
VCP PATTERN RESEARCH · U.S. EQUITIES
Understand the pattern.
Follow the evidence.
A clear path from learning Volatility Contraction Patterns to studying today’s setups and reviewing past breakouts.
Latest verified U.S. data: 2026-11-16 · Updated after completed U.S. sessions
FOUR CONNECTED PERSPECTIVES
From an idea to a record.
Learn the concept. Understand the rules.
Explore the observations. Review the history.
- 01 UNDERSTAND
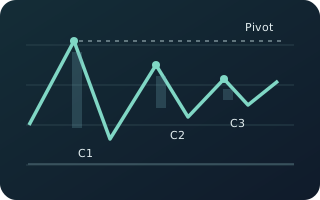
What’s VCP?
See how a tightening price range can form a setup worth studying.
Learn the pattern - 02 IDENTIFY
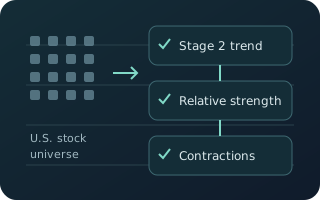
Our Method
Follow the same defined checks for trend, strength and contraction.
Explore our rules - 03 OBSERVE

Today’s VCP
Study verified near-pivot setups and breakouts, each with its actual data date.
View latest observations - 04 REVIEW
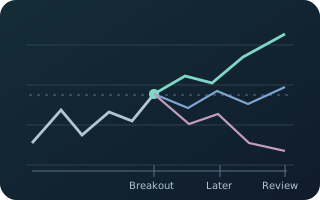
Track Record
Revisit past breakouts and compare their observed price paths over time.
Review the history
Illustrations explain the research process; they are not live signals or measured results.
One method. A history you can examine.
The method defines what enters the observation list. Track Record lets you review past breakouts under those rules. A setup may never break out, and a breakout may fail.